Seems like the 10ms pause thing provokes a much sharper reaction (at least among this crowd) than this little nugget:
"Hardware provisioning should allow for in-memory heap sizes twice as large as reachable memory."
So I know "memory is cheap"(TM) but surely a 100% physical RAM overhead for your memory management scheme is worth at least a small amount of hand-wringing. No?
It is normal, not even a too big demand, as soon as you accept that the system depends on the GC. They are just being honest, even slightly optimistic. The current state of art is, you should suspect anybody who claims to you that GC systems don't need significantly more RAM.
That is misleading (and that article is really bad in other ways, too, but that's a different story).
First of all, the "most GCs" are the non-generational GCs.
That's well known. The amount of tracing work that a non-generational allocator has to do per collection is proportional to the size of the live set. Thus, collecting less frequently (by increasing the heap size before another collection has to occur) makes GC faster, using time roughly inversely proportional to how much bigger you make the heap.
Generational collection can greatly mitigate tracing of the live set for when you have many short-lived objects that never leave the nursery.
Second, the benchmark compares the allocation/collection work of various garbage collectors vs. an oracular memory manager using malloc()/free(). Not only do alternative solutions that don't use automatic memory management not necessarily match this performance (naive reference counting tends to be even slower, pool allocation also can have considerable memory overhead, etc.): more importantly, it's an overhead that applies only to the allocation/collection/deallocation work. For example, if your mutator uses 90% of the CPU with an oracular memory manager, then a 100% GC overhead means 10% total application overhead.
Agree with what you wrote, but the GC system also imposes various forms of overhead that aren't reflected in the paper. Some are explicit: read/write barriers, finalizers, weak references, etc. Others are implicit in the language limitations necessary to support GC: no unions, no interior pointers, no pointer packing, no easy C interop, etc.
It's difficult to measure this overhead, because you design the program around the limitations of your language. The point is that, by rejecting GC, you gain certain flexibilities that can enable higher-performance designs. Merely removing GC from a Java app doesn't capture that.
I really welcome the links to the better measurements and graphs. Please give me the hard data, properly presented, don't write the claims without the citations. I really want to learn more.
Correct me if I'm wrong, but even the "generational" GCs present their own problems: the "costs" of having the GC increase not only with having "too little" memory but also with trying to use "too much" memory (as "more than e.g. 6-8 GB, which can be needed on the server applications). As far as I know, only Azul's proprietary GC is claimed to avoid most of the problems typical for practically all other known GCs. fmstephe in his comment here linked to one discussion where the Azul's GC author participated. But I nowhere read the claim that any GC doesn't need significantly more RAM than manual management.
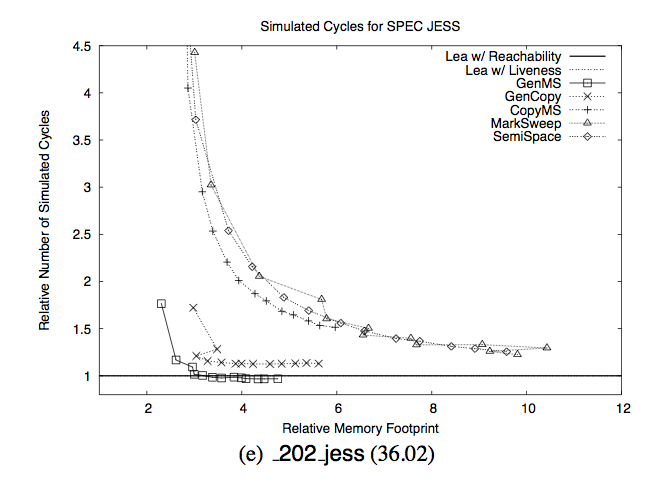
Please be clear. Do you claim it's misleading that the GCs need at least twice as much RAM to be performant? If so, based on what actually do you claim that the graph I linked doesn't support that? Can you give an example of some system that does better, with measurements etc?
> Do you claim it's misleading that the GCs need at least twice as much RAM to be performant?
This is not what you wrote. You said that "most GCs start being really slow even with 3 times more memory than needed with the manual management", while the generational mark-sweep collector has essentially zero overhead with 3x RAM in that benchmark. The "most GCs" you're referring to are algorithms that are decades behind the state of the art.
Also, "really slow" is a fuzzy term and I am not sure how you come to that conclusion from the image.
Remember, they're compared to an oracular allocator that has perfect knowledge about lifetime/reachability without actually having to calculate it. That ideal situation rarely obtains in the real world. The paper uses this case to have a baseline for quantitative comparison (similar to how in some situations speeds are expressed as a fraction of c), not because it represents an actual and realistic implementation.
You answered nothing what I asked from you. I asked for links, measurements, graphs.
Your only arguments: after showing that I wrote "most need even 3 times more" then you give an example of one which needs 2 times more. Then you complain that "really slow" is fuzzy. Then you claim that "ideal situation rarely obtains in the real world."
My point is that you don't understand your own source. The "links, measurements, graphs" are in the paper you referenced, they just say something different from what you believe they are saying.
If you're struggling with understanding the paper, there's really nothing more I can do to help.
Apart from the claim that I use "fuzzy" words or that my set of "most GCs" unsurprisingly doesn't include the kind that Go still doesn't have and probably won't have for some years more, what have I written that you actually refuted?
You can trade CPU usage for heap size, for the purposes of the plan it sounds like they wanted to be able to pick some concrete goals so they've picked 100% slack RAM and 25% additional CPU as their numbers. If you wanted 50% then the CPU overhead might be 50% on the same workload.
For a lot of applications on a GCed runtime 100% isn't an unreasonable number though. To get the overhead down you can manage your memory more carefully (pooling, keeping most objects pointerless) and tell the GC to run earlier.
This does not sound accurate. Memory access dominates in most current programs, and it dominates by a factor of several hundred (meaning one memory access takes more time than 100 L1 cache hits). If you use more memory, by necessity your cache will be less efficient. In the vast majority of cases, it's not worth it.
If you trade cpu usage for heap size, you'll lose in all modern cpus. In fact it's getting to the point where worse algorithms that are space-efficient are starting to beat the best known algorithms in practice, even if their constants are different. Dual TLB lookup when running virtualized doesn't help with that either.
If you can avoid a memory read with 4-500 assembly instructions (say a C/C++ function of half a screen), that is actually worth it. I did a test on my newest machine that showed that it's actually more efficient to run the sieve of Eratosthenes algorithm for prime numbers under ~800, than to have a table in memory with those primes.
It also means that you should easily be able to execute about a page of inlined C/C++ code in the time it takes the cpu to simply jump to a virtual function. Go and Java only have virtual functions.
Likewise, having programs work directly in compressed memory is actually a net-win. E.g. storing protobufs in memory and unpack single fields out of them when used instead of using unpacked structs directly is actually a win for even quite large structs. Not for megabyte-long ones, but you know, in 2 years there'll be a new intel micro-arch and who knows ?
Good luck keeping objects pointerless in Java. Or go for that matter (you can't use any interfaces or pointers if you do).
But don't take my word for this. Here's a trivially simple test. Gcc can compile java programs down to machine code. The memory model of those compiled things is different from the jvm. Take what you consider a slow java program, gcc it, and execute it. Note the 100%+ improvement in speed. (only really works for memory intensive stuff, of course). Rewriting it in C++ (assuming you know what you're doing) will get you another 100%+ improvement.
I think we're talking different scales here. At the scale of things that are roughly cache sized your point makes sense. The big concern about pauses is mostly coming from users with heaps in the 10s of GB and it's pretty unlikely on a PC you'll have more than 100MB of L2.
When it comes to designing the data structures your app uses you have a point but I think it's not directly to your app or runtime's policy for reclaiming freed objects. This does raise an idea that hadn't occurred to me before though: once you have a generational moving collector you may actually get virtuous cache effects because your nursery is densely packed with live objects.
...
Ok, it turns out that this has not only been studied a little but but at least PyPy tried this at one point (I looked at the code but couldn't find it).
100% over-provisioning is roughly what is currently required for performance by all systems that allow arbitrary allocation of arbitrarily sized data. Including most GC implementations and most malloc/free implementations. (You can of course do much better if you can limit the size or timing of allocations.)


"Hardware provisioning should allow for in-memory heap sizes twice as large as reachable memory."
So I know "memory is cheap"(TM) but surely a 100% physical RAM overhead for your memory management scheme is worth at least a small amount of hand-wringing. No?